Interfacing Code with the Physical World: A Crash Course in Processing and Arduino
Garnet Hertz, 2012 Values in Design Workshop, University of California IrvineWhat is this?
This is an introduction to Processing and Arduino, with the goal of providing you with new skills to help you quickly prototype and develop your own physical computing projects. Processing is an open source programming language and environment for people who want to create images, animations, and interactions. Arduino is an open-source hardware prototyping platform intended for artists, designers, hobbyists, and anyone interested in creating interactive objects or environments. In this workshop, you will learn how the Arduino can sense information from the real world and how Processing can visualize it on a computer.
If you've been wanting to try out either the Arduino or Processing, this workshop is for you.
Why?
- To be able to feel and understand data.
- To get hands-on experience with new tools.
- To help facilitate you to implement your projects in the real world.
- To help expand the legibility of your projects by being physical things.
We're Going to use Processing and Arduino to Graph Output from a Physical Knob
We are going to do a crash course on getting Processing and Arduino running individually, and then use an example to get them running together through a simple example that draws a graph when you turn a physical knob. This "Graph" example is based on an example by Tom Igoe. This example shows you how to send a byte of data from the Arduino to a personal computer and graph the result. This is called serial communication because the connection appears to both the Arduino and the computer as a serial port, even though it may actually use a USB cable.
You will also learn a few simple things about electronics.
Hardware Required
- Arduino Board
- USB (A-B) Cable
- Analog Sensor - we'll be using a potentiometer (which is like a volume knob)
Software Required
Let's install, configure and test Processing
- Work in pairs - grab a partner!
- Download Processing to both of your laptops
- The Processing development environment is organized like this:

- Test Processing by trying to get some examples working. Use the examples menu to test things out:

- Find the Basics > Input > MouseSignals example and double-click it
- It should look something like this:

- Hit the "Play"-type button on the top left of the window to run the program. If it works, a small window will pop up like this that will respond to your mouse movements and clicking:

- If you have problems, see if the example on your partner's laptop is working. Check out Troubleshooting tips
- QUESTION: A Processing program (AKA "sketch") has two main parts, a setup and a draw section. Can somebody help explain what each of these do in this MouseSignals example?
Next, let's install, configure and test the Arduino software and hardware...
- Download and install the Arduino Software - you know the routine. If you don't know the routine, look around to see what others are doing and make an educated guess.
- Next, take the Arduino hardware out of its pretty little box. Make mental note of what type of Arduino it is... confirm that you have a "Uno". Raise your hand and let me know if you have something else:

- Plug the board into your computer with a USB cable. QUESTION: Do you see any green and/or yellow lights on the I/O board? Discuss.
- Fire up your Arduino app on your computer. The interface looks similar to Processing, but it looks more iMac-1998-Bondai-blue-ish.
- THIS IS WHERE MOST NEWBIES INITIALLY FAIL! Make sure you have the right item selected in the Tools > Board menu. If you have an Arduino Uno, you'll need to choose it.

- Then, check that the proper port is selected in the Tools > Serial Port menu (if your port doesn't appear, try restarting the IDE with the board connected to the computer). On the Mac, the serial port should be something like /dev/tty.usbmodem621 (for the Uno or Mega 2560). On Linux, it should be /dev/ttyACM0 or similar. On Windows, it will be a COM port but you'll need to check in the Device Manager (under Ports) to see which one.
- A few things to note about the Arduino interface that are important:

Verify - Checks your code for errors.

Upload - Compiles your code and uploads it to the Arduino I/O board...
(This is an important button which needs to be clearly understood)


New, Open and Save

Serial Monitor - Opens the serial monitor - this displays serial data being sent from the Arduino board.
- Let's test everything by trying to upload some example code to the Arduino I/O Board
- Open up the File > Examples > 01.Basics > Blink example:

- Take a look at the Blink code:

-
Try verifying and uploading the Blink code to the Arduino board.
- If everything works, you should see something like "Done uploading. Binary sketch size: 1,084 bytes (of a 32,256 byte maximum) in the black Console area at the bottom of the code.
- If you have problems at this point, you can read some Arduino Troubleshooting Tips
- QUESTION: What are the main parts of this Arduino Blink program? How is this different from the Processing MouseSignals code?
- QUESTION: Look at the yellow light on your Arduino board. After you've uploaded it, is it blinking?
- Open up the File > Examples > 01.Basics > Blink example:
- CHALLENGE 1: Try to make your yellow light blink faster or slower. Discuss this with the people at your table.
- CHALLENGE 2: Try to make your yellow light blink a morse code SOS signal: three short blinks, three long blinks, and then three short blinks. Discuss this with the people at your table.
- ADVANCED CHALLENGE - BE CAREFUL IF YOU TRY THIS: Insert an LED into pins 13 and ground (GND). NOTE: Insert the long end of the LED (+) into pin 13. Insert the short end (-) into GND.


- Congrats! We've now successfully got Processing and Arduino running! Let's take a break - after the break, we'll get these things both working together.

Arduino "Graph" Code
Paste this code into a new Arduino sketch and save it:
Graphing potentiometer sketch - Arduino code
A simple example of communication from the Arduino board to the computer:
the value of analog input 0 is sent out the serial port. We call this "serial"
communication because the connection appears to both the Arduino and the
computer as a serial port, even though it may actually use
a USB cable. Bytes are sent one after another (serially) from the Arduino
to the computer.
You can use the Arduino serial monitor to view the sent data, or it can
be read by Processing, PD, Max/MSP, or any other program capable of reading
data from a serial port. The Processing code below graphs the data received
so you can see the value of the analog input changing over time.
The circuit:
Any analog input sensor is attached to analog in pin 0.
created 2006
by David A. Mellis
modified 9 Apr 2012
by Tom Igoe and Scott Fitzgerald
This example code is in the public domain.
http://www.arduino.cc/en/Tutorial/Graph
*/
void setup() {
// initialize the serial communication:
Serial.begin(9600);
}
void loop() {
// send the value of analog input 0:
Serial.println(analogRead(A0));
// wait a bit for the analog-to-digital converter
// to stabilize after the last reading:
delay(10);
}
Let's Add a Potentiometer and Test it with the Arduino
Connect a potentiometer or other analog sensor to analog input 0. This is what the circuit should look like:

This is the schematic diagram of the circuit:
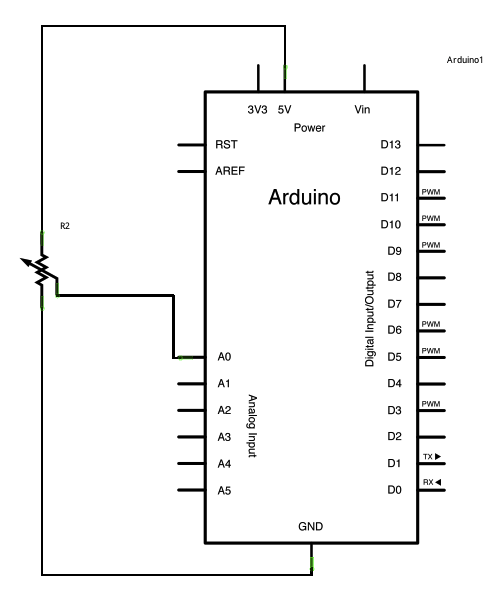
A potentiometer is like a volume knob. As you turn the knob, more or less electricity comes out of the center pin. In our example, the Arduino checks the amount of electricity on pin A0 and converts it to a value that is output on the USB port.
Run the sketch. Open up the Serial Monitor window and turn the knob. You should be able to see the number values change between 0 and 1023:

Processing "Graph" Code
Paste this code into a new Processing sketch and save it:
// This program takes ASCII-encoded strings
// from the serial port at 9600 baud and graphs them. It expects values in the
// range 0 to 1023, followed by a newline, or newline and carriage return
// Created 20 Apr 2005
// Updated 18 Jan 2008
// by Tom Igoe
// This example code is in the public domain.
import processing.serial.*;
Serial myPort; // The serial port
int xPos = 1; // horizontal position of the graph
void setup () {
// set the window size:
size(400, 300);
// List all the available serial ports
println(Serial.list());
//
// I am assuming that the Arduino is connected to USB
// on /dev/tty.usbmodem621, so I open Serial.list()[4]
//
// To find out which serial port talks to your Arduino,
// open the Arduino IDE and look up ŇTools > Serial PortÓ.
// Compare that to the entry in the list in your Processing
// console output after you run this sketch, and select
// this one by its number...
//
// The list will look something like this:
// [0] "/dev/tty.Bluetooth-PDA-Sync"
// [1] "/dev/cu.Bluetooth-PDA-Sync"
// [2] "/dev/tty.Bluetooth-Modem"
// [3] "/dev/cu.Bluetooth-Modem"
// [4] "/dev/tty.usbmodem621"
// [5] "/dev/cu.usbmodem621"
myPort = new Serial(this, Serial.list()[4], 9600);
// don't generate a serialEvent() unless you get a newline character:
myPort.bufferUntil('\n');
// set inital background:
background(0);
}
void draw () {
// everything happens in the serialEvent()
}
void serialEvent (Serial myPort) {
// get the ASCII string:
String inString = myPort.readStringUntil('\n');
if (inString != null) {
// trim off any whitespace:
inString = trim(inString);
// convert to an int and map to the screen height:
float inByte = float(inString);
inByte = map(inByte, 0, 1023, 0, height);
// draw the line:
stroke(127,34,255);
line(xPos, height, xPos, height - inByte);
// at the edge of the screen, go back to the beginning:
if (xPos >= width) {
xPos = 0;
background(0);
}
else {
// increment the horizontal position:
xPos++;
}
}
}
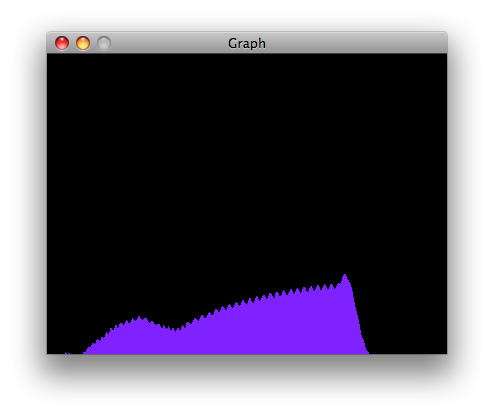
What The Processing Sketch Should Look Like
Using the Processing sketch in the code sample above, you'll get a graph of the sensor's value. As you change the value of the analog sensor, you'll get a graph something like this:
Oh No! I don't see anything!
- A common problem is that your Arduino is outputting data on one port, while Processing is listening to a different port. To find out which serial port talks to your Arduino, open the Arduino IDE and look up Tools > Serial Port. Compare that to the entry in in the "println(Serial.list());" and select this one. By default, the code above connects to port 4, which may be incorrect.
- Another problem may by an issue with a mismatch between RXTX libraries. Note that Processing can work fine with Arduino despite RXTX warnings in the console. Attempting to update or fix RXTX is difficult, but you can try it as a last resort: here are instructions on updating RXTX libraries at sundh.com. Good luck.
More advanced things to try
- Try connecting a light sensor: http://www.codingcolor.com/microcontrollers/arduino-night-light-using-a-photocell/ - and try adapting this two-wire sensor (as opposed to a three-wire potentiometer) to graph something in Processing. (This example requires a 10K resistor, a breadboard, and some wires.)


- Try to adapt a different Processing example to be controlled by a potentiometer. (Will not be explained today - do this on your own.)
Thanks!
That is what you should now look like:
